DATA ANALYSIS: EXPLORING NIGERIAN STUDENTS’ WAEC PERFORMANCE
A MICROSOFT EXCEL PROJECT
The West African Examination Council was formed in 1952, with the mandate of developing sound education, maintaining educational standards, and, painting the vision of the potential lying beyond education for the West African People. WAEC conducts examinations, usually considered “crucial,” for students wanting admission into the university.

Statistics from this examination could put a country’s educational system in perspective. In some cases, it may give finer or more in-depth insights into how different parts of a country might be faring education-wise.
In August 2022, the National Bureau of Statistics (NBS) published a report on state-wise participation and performance of Nigerian students in the WAEC examination, from 2019 to 2021. In this report, the NBS, while pointing out the fall-rise pattern in total participation over the period, reached two conclusions:
- Nigerian public schools have higher participation compared to private schools.
- the South-Western and South-Southern part of the country leads in terms of participation.
AIMS AND OBJECTIVES
This project was carried out based on the following aims:
- Using Microsoft Excel to perform exploratory data analysis on statistics from WAEC.
- Detailing the participation and performance of students.
- Providing a visualization of the results
METHODOLOGY
DATA COLLECTION
Attached to the report by the NBS is a spreadsheet file containing participation and performance numbers by state and year.
This file has three tabs: 2019, 2020, 2021, and Analysis. The first three tabs contain data for the respective years, while the last tab summarizes the other three tabs.

In each of the first three tabs, there are different tables. The tables show participation and performance by state. The tables describe this in terms of male and female participation and performance by public and private schools in the different states of Nigeria, including the Federal Capital Territory.
DATA CLEANING
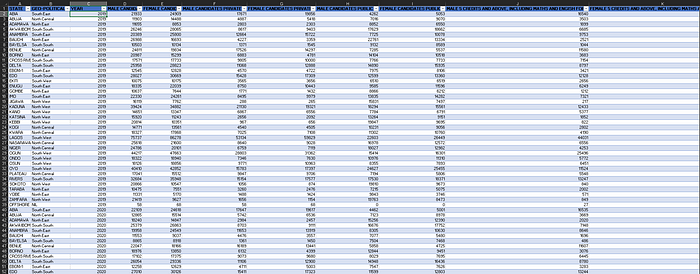
The data had to be cleaned to ensure that the data in this file was ready for eventual data analysis. First, a new table was created for the 2019 data, under the Clean2019 tab. This table had the following columns:
State, Male Candidates, Female Candidates, Male Candidates Private Schools, Female Candidates Private Schools, Male Candidates Public Schools, Female Candidates Public Schools, Male 5 Credits And Above (Including Maths And English) For Private Schools, Female 5 Credits And Above (Including Maths And English) For Private Schools, Male 5 Credits And Above (Including Maths And English) For Public Schools, Female 5 Credits And Above (Including Maths And English) For Public Schools.
The same was repeated for the years, 2020 and 2021, under the Clean2020 and Clean2021 tabs, respectively. The values for the columns were filled using the XLOOKUP function. The SUM function was used to obtain the aggregate male and female students by state, which fell under the Male and Female Candidates columns, respectively. Then, a Geo-political Zone column was added. Alongside, a new tab, StatesAndGeopoliticalZones was added and used together with the XLOOKUP function to fill the Geo-political Zone column.
The initial plan was to combine the three tables using the VSTACK function, but that failed as it could only combine two tables, at a time. The regular Ctrl C and Ctrl V was later deployed. The final data was placed in the Cleaned Data tab.

Lastly, a Year column was added (using Down Fill) to demarcate the data by year. The cleaned data looks like this:

ANALYSIS
For analysis, pivot tables and pivot charts were employed. This exploratory data analysis was divided into Participation and Performance, to describe the data. Participation here, refers to the total number of candidates, regardless of their performance during the examination.
Participation
Total Number of Candidates, Total Number of Public School Candidates, Total Number of Private School Candidates: these three analyses were performed together and summarized with a clustered bar chart.
After inserting a pivot table showing the number of male and female candidates in public and private schools, a Year slicer was inserted to filter the pivot table by year. Before the chart was inserted, the data was restructured to be able to feed the chart.
Net Female/Male Candidates: for this, a Calculated Field titled NET FEMALE was added. This field is the difference between the number of female and male candidates. This analysis aimed to show how females participated in the Geo-political Zone.
A bar chat was inserted side-by-side with the pivot table to buttress this analysis. Also, the slicer used for the first analysis was linked to this. The same was done for NET MALE.
Top Five States: a combination of pivot table, horizontal bar chart, and top five filter was employed for this analysis. It showed states with the highest number of candidates.
Bottom Five States: this on the other hand showed the states with the lowest number of candidates.
Performance
Before proceeding, it is imperative to acknowledge that achieving a pass in WAEC typically entails attaining a minimum of five credits, including Mathematics and English. The following analyses are made against the backdrop of this understanding.
Total Passes, Total Public Passes, Total Private School Passes: like above, this chart shows male and female passes in public and private schools with a clustered bar chart. A year slicer is also inserted to show Year-wise numbers.
Net Male/Female Passes: this analysis uses pivot tables, bar charts, and Calculated Fields to show what geopolitical zones had higher male and female passes.
Top Five Performing States: this approach utilizes the concept of calculated fields and proportions to determine and showcase each state's performance. The analysis focuses on identifying the top five states based on two key factors: the total number of candidates who participated in the examination and the number of candidates who successfully passed.
Bottom Five Performing States: similarly, in both cases, a bar chart represents the values visually. This approach emphasizes the identification of the states with the lowest performance, as determined by the criteria above.
A dynamic title was added to the visualization. The title changes based on the year(s) selected in the slicer.
RESULTS
The results show that:
- Over the three years under review, about 4.6 million candidates participated in the examination. There was a fall-rise pattern from 2019 to 2021. The Year on Year growth rate went from -3.3% between 2019 and 2020 to +1.4%, between 2020 and 2021.
- More candidates wrote the examination in public schools (54%) than in private schools (46%).
- There were more male candidates in public schools compared to their female counterparts. The opposite was obtainable in private schools.
- The Net Male/Female analysis showed that Northern states (North-East, North-West, and North-Central) had fewer female candidates compared with their male counterparts over the three years. The reverse was the case with Southern states (South-West, South-East, South-South).
- Kaduna, Oyo, Ogun, Rivers, and Lagos featured consistently as states with the highest number of candidates, with Lagos state in the lead.
- Gombe and Taraba states consistently had some of the fewest candidates throughout the period.
- Across the three years, a gender gap emerged in the number of successful candidates. Northern states consistently had fewer successful female candidates compared to Southern states.
- 53% of successful candidates came from private schools.
- Mirroring the participation trend, southern states saw more successful female students than northern states.
- Abia, Imo, and Edo states were among the top performers, ranking in the top five states in two out of the three years. Their cumulative pass rates were 89%, 85%, and 83%, respectively.
- Just Yobe State featured consistently in the ranking of the least-performing states (36% cumulative).
Find below a visualization of the results made with Microsoft Excel:

CONCLUSIONS AND RECOMMENDATIONS
This project analyzed WAEC data to understand candidate participation, and performance trends, and present the findings through data visualization.
This analysis defines ‘successful’ candidates as those achieving at least five credits, including Math and English. Pass rates are calculated by dividing the number of successful candidates by the total number of candidates.
Here are some recommendations:
- States with low pass rates should investigate factors contributing to lower student success.
- Investigating the reasons behind the low pass rates (below 50%) in public schools remains critical for the government.
- To improve student outcomes, the government can explore strategies to raise the national cumulative pass rate (public and private schools) beyond 68%.
Thank you for reading through. I would love to get your feedback.
